 Slopcouver
Labs · Experiment 2 of 7 · Remote sensing, Open data, Maps
A free, dated satellite layer for a city map
- Started
- Updated
- Status
- shipped
- Verdict
- Supported
Can free Copernicus Sentinel-2 imagery give a city map a dated, refreshable satellite view that lines up with the City's own aerial photos, and is the catalogue's cloud figure a reliable way to pick a pass?
Why
The City of Vancouver's 2022 orthophotos are superb (7.5 cm per pixel) but they are one summer, flown once. A map that wants to show now, or show change, needs a source that revisits. The European Copernicus Sentinel-2 satellites photograph every point on Earth every few days at 10 m per pixel, and the data are free. The questions were whether we could use it without an account or a whole-tile download, whether it registers to the City's photos, and how to choose a usable pass in a rainy city.
Hypotheses
- Alignment: Sentinel-2 Level-2A, resampled onto our map grid, lines up with the City's 2022 orthophotos to within one 10 m pixel everywhere we test.
- Cloud: the catalogue's cloud percentage, computed over the whole 110 km satellite tile, is a poor guide to whether a pass is usable over our 20 × 15 km area; measuring cloud over our area picks different passes.
- Calibration: the published scale and offset metadata can be trusted to turn stored numbers into surface reflectance.
Method
- Area: −123.29, 49.19 to −123.01, 49.33 (Vancouver and UBC), entirely inside Sentinel-2 grid tile 10UDV.
- Source: Sentinel-2 L2A (surface reflectance) through Element 84's public Earth Search STAC API (collection
sentinel-2-l2a), which needs no account. Files are cloud-optimised GeoTIFFs in the AWS open-data registry. - Read only our window: bands B02, B03, B04 (blue, green, red, 10 m) and SCL (scene classification, 20 m), fetched by HTTP range requests through GDAL's
/vsicurl. A few tens of MB in all; 74 MB stored per scene. - Cloud over our area: on the 20 m SCL, "clear" is classes 4, 5 and 6 (vegetation, bare, water); everything else is excluded and the exclusion is grown by two pixels (40 m).
- Calibration check: read the darkest pixels (deep water, darkest 5%; all valid pixels, darkest 1%) and compare with the +1000 offset the metadata implies.
- Tiles: the map's own web-mercator grid, 512 px tiles, zoom 10–13 (zoom 13 is about 6.2 m on the ground here, so the 10 m bands are lightly oversampled). Cubic resampling for the bands, nearest for SCL. One fixed colour stretch for every date (white at 0.24 reflectance, gamma 0.62) so dates compare. WebP quality 82.
- Alignment: normalised cross-correlation of 0.9 km windows, Sentinel-2 luminance against the City orthophotos averaged onto the same 9.55 m grid, with sub-pixel peaks, at four places.
- Tools: Python 3, GDAL, NumPy, Pillow; Playwright for the screenshots. Hardware: one Debian desktop; no GPU needed.
- Time: a rebuild with no new scene takes about 40 s, about 1 minute with one new scene. Cost: none.
Results
Cloud: the catalogue figure points the wrong way
| Scene | Acquired (UTC) | Catalogue cloud (whole tile) | Clear over our area | Role |
|---|---|---|---|---|
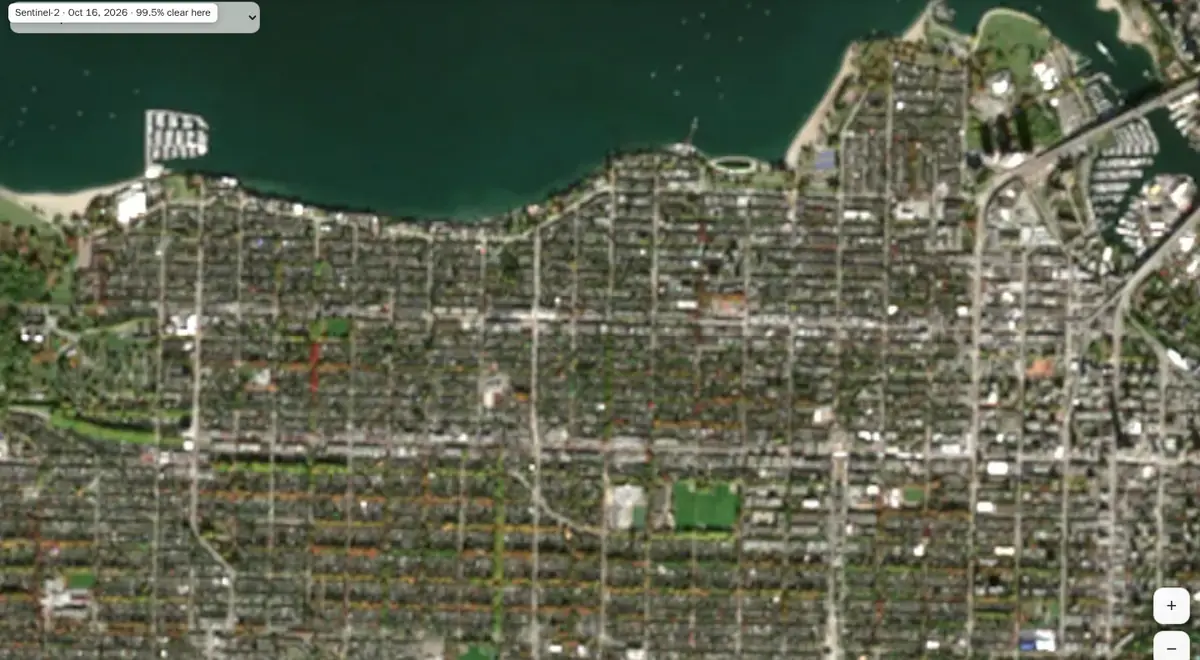
| Sentinel-2C, 16 Oct 2026 | 19:20 | 33.4% | 99.50% | most recent usable pass: the default |
| Sentinel-2B, 24 Jun 2022 | 19:21 | 0.04% | 98.87% | comparison, inside the orthophotos' flight window (6 Jun–1 Jul 2022) |
A pass the catalogue calls a third cloudy is 99.5% clear over the city. The newer passes, newest first, were measured too:
The rule we adopted: newest pass with full coverage and at least 95% clear over our area. The map's badge says exactly that: "Sentinel-2 · Oct 16, 2026 · 99.5% clear here".
Calibration: the metadata disagrees with itself; the bytes settle it
Every band says scale 0.0001 and offset −0.1, but a processing flag says the offset is already applied for 2026 (processing baseline 05.13) and not for 2022 (baseline 04.00). If the +1000 offset were still in the numbers, dark water would read above 1000.
| Scene | Deep water, darkest 5% (blue / green / red) | Darkest 1% of all pixels (blue) |
|---|---|---|
| 2026 | 93 / 134 / 47 | 33 |
| 2022 | 204 / 233 / 110 | 120 |
So for both scenes, reflectance = value × 0.0001 with no further offset, even for the 2022 item whose flag says otherwise; applying the −0.1 would make water negative. The rebuild re-checks this for every new scene and stops if dark water rises above 700.
Alignment: a quarter of a pixel
| Place | Shift east, south (m), 2026 | Correlation peak |
|---|---|---|
| Stanley Park | +1.9, +1.8 | 0.53 |
| False Creek (Granville Island) | +1.1, +1.8 | 0.74 |
| Point Grey, Jericho | −0.2, −0.8 | 0.61 |
| Point Grey, UBC | +1.2, −1.1 | 0.61 |
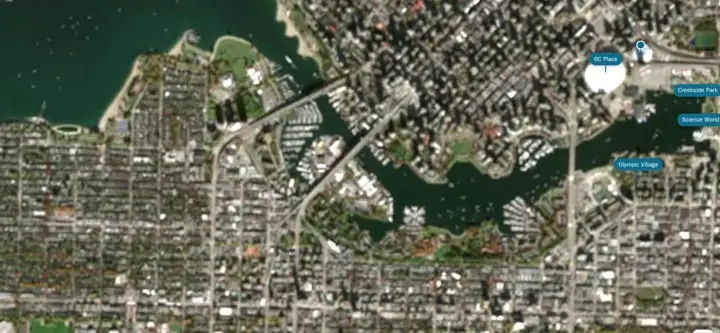
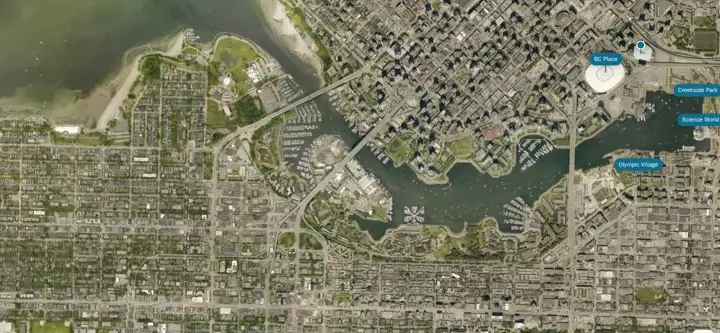 Sentinel-2, Oct 2026City orthophoto, 2022
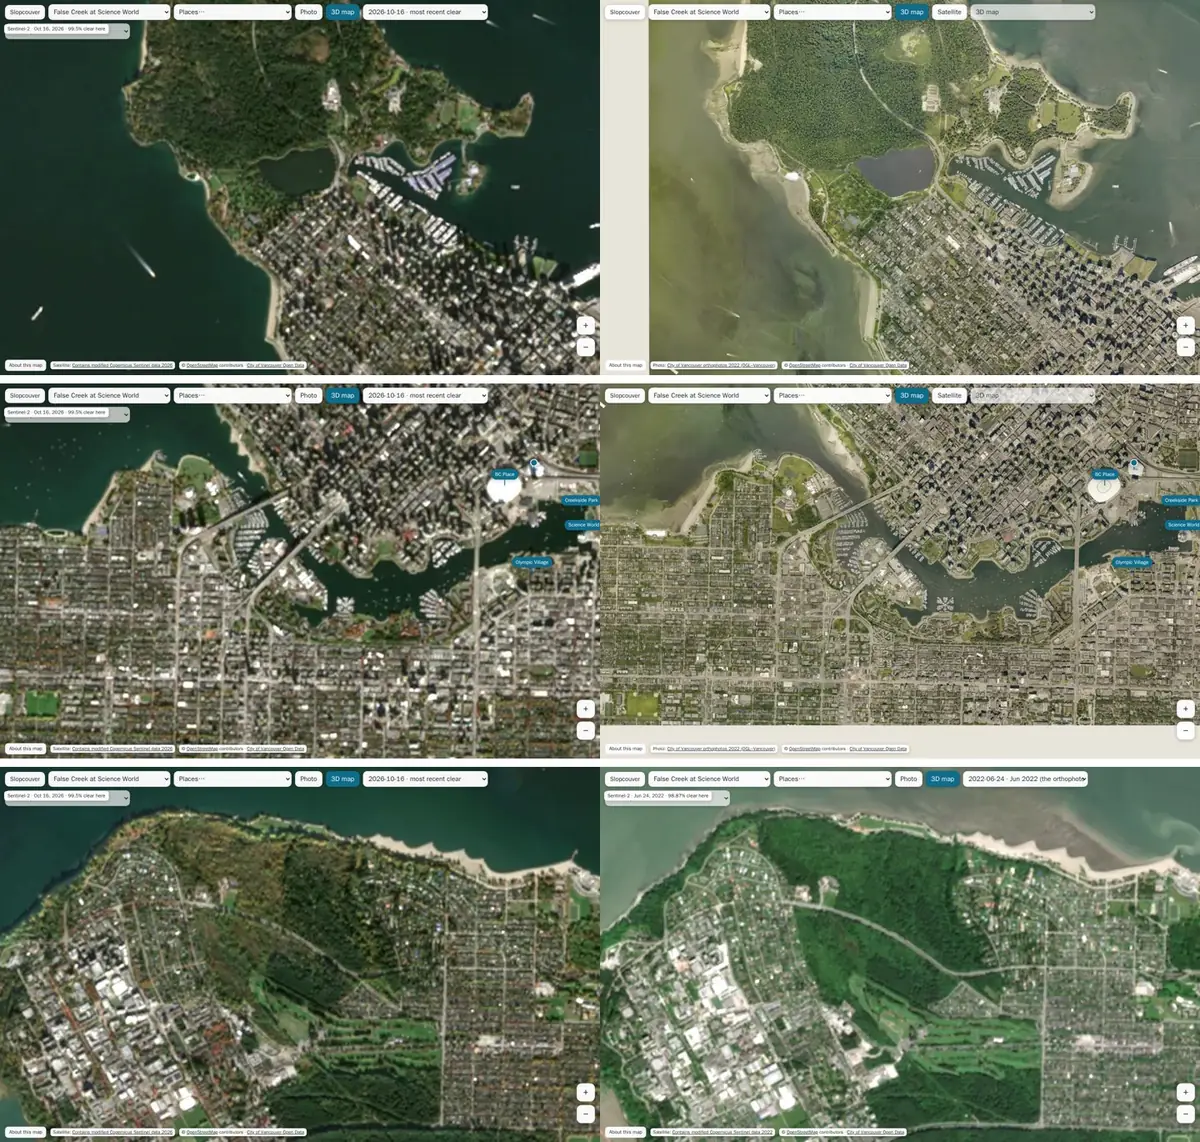
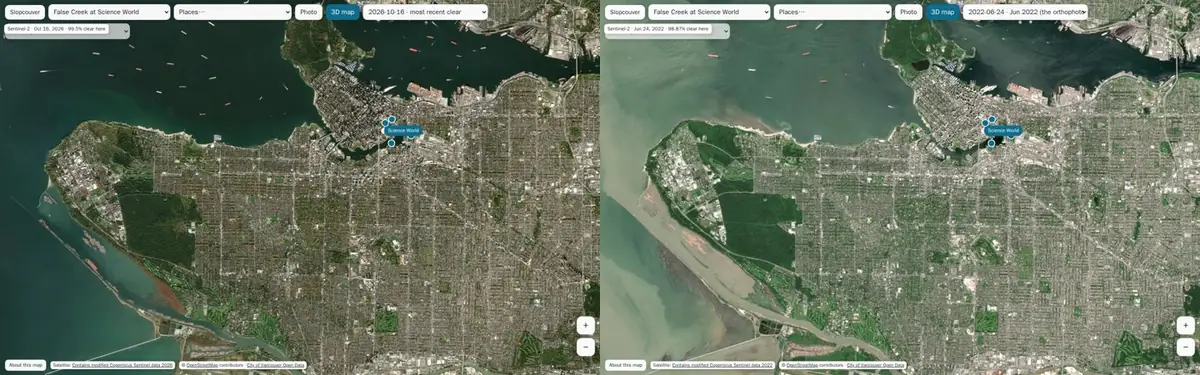
Limitations and threats to validity
- Calibration rests on physical plausibility, not a comparison with the original JPEG 2000 files, which are in a requester-pays bucket that needs an AWS account. We didn't use one.
- Four alignment sites and correlation peaks of 0.53–0.74: enough to rule out a pixel-scale error, not to map sub-pixel distortion across the area.
- Two dates only. A pass is shown whole, with its measured clear share; there is no cloud masking on the image.
- The 95% rule is ours. In a long wet spell the newest usable pass can be weeks old (16 October, when this was built on 8 November).
Verdict
Supported Alignment within a quarter pixel (2026) and under one pixel (2022): hypothesis 1 holds.
Supported Catalogue cloud is a poor guide: a "33% cloudy" pass was 99.5% clear here, and recent "clear-ish" passes were unusable. Hypothesis 2 holds.
Not supported The metadata can't be trusted as published: its offset and its flag contradict each other for 2022, and the bytes show no offset in either scene. Hypothesis 3 fails, which is why the check runs on every rebuild.
Practical application
- For the map: live on the ISO map as the Satellite layer, with the pass date and clear share on screen. 132 tiles, 3.5 MB for both dates.
- For anyone building a city map: a dated satellite base with no account, no licence fee and no whole-tile downloads. Measure cloud over your own area; don't trust the tile-wide figure.
- For other cities: change the bounding box and grid tile. Areas crossing a grid-tile edge need a mosaic of two tiles (for Vancouver, the North Shore, Burnaby and Richmond would add 10UEV).
- What it would take to keep it fresh: a scheduled rebuild, a review step and publishing to the map's tile host. The rebuild is one command; scheduling and publishing are not set up yet.
Follow-up experiments
Four questions follow from this layer. They have started; each will get its numbers here when it reports.
| Experiment | Question | Status |
|---|---|---|
| Change detection | Can two passes four years apart find new buildings and cleared land reliably at 10 m, against the City's permits and our building data? | running |
| Cloud-free composite | Does a per-pixel composite of several part-cloudy passes beat the single best pass for a rainy season? | running |
| Super-resolution | Do open super-resolution models add real detail to 10 m imagery, judged against the 7.5 cm orthophotos, or only plausible texture? | running |
| Ortho fusion | Can the 2022 orthophotos be colour-shifted to a recent satellite pass so a sharp photo shows the current season? | running |
Reproducibility
Scripts in tools/iso/satellite/ of the Slopcouver repository (private for now; shared on request): rebuild.py (search, measure, build), calib.py, align.py.
python3 rebuild.py "$PWD"              # newest pass with full data and ≥ 95% clear over the area
python3 rebuild.py "$PWD" --dry-run    # report which pass it would use
python3 rebuild.py "$PWD" --days 120 --min-clear 95
Data and credits: Contains modified Copernicus Sentinel data 2022 and 2026, accessed through Element 84 Earth Search and the AWS Registry of Open Data. Orthophotos 2022: City of Vancouver Open Data, OGL–Vancouver. Map labels: OpenStreetMap contributors, ODbL.